Each note starts with what it sounds like, then shows the measurement behind it. Nothing here is a claim about feel - it is what the signal did on the bench.
2026-09-20
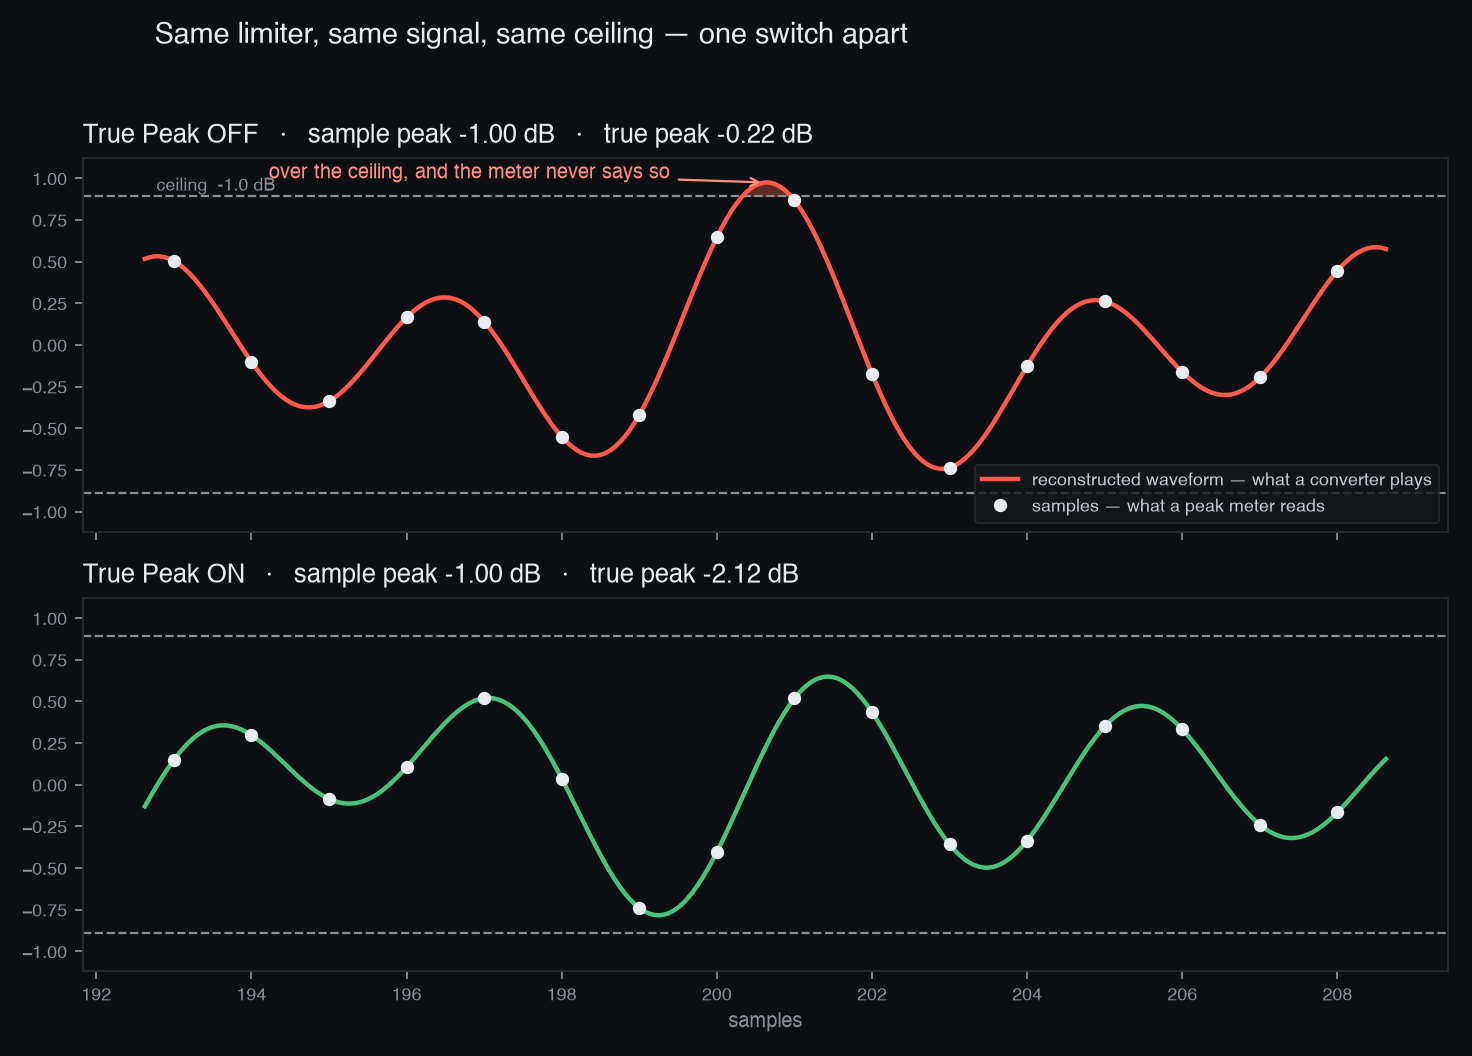
Your peak meter says -1.0 dB. The waveform says -0.22 dB.
What you hear: nothing, on your own speakers, on the day you bounce it. Then the mix goes to streaming, gets encoded, and the loudest moments come back with a thin crackle on the top end - cymbals, sibilance, the snare edge. That is this.
| sample peak | true peak | over the ceiling |
|---|
| True Peak off | -1.00 dB | -0.22 dB | +0.78 dB |
| True Peak on | -1.00 dB | -1.00 dB | 0.00 dB |
A peak meter reads the samples. A converter does not play the samples - it plays the smooth curve that passes through them. Limit the samples only, and the curve in between can sit above the ceiling while every number on your meter says you are safe.
Whether that is audible depends on what happens next. Straight out of a good converter, one or two overshoots of this size usually pass unnoticed. Through an mp3 or AAC encoder, they do not: the encoder has to represent that curve, overshoots and all, and what comes out the other side is clipped. That is why distributors ask for -1.0 dBTP and why a master can pass your meter and fail theirs.
The test: tones near a quarter of the sample rate - the worst case for this, because the samples land either side of each crest - through Shane Limiter twice, once with True Peak off and once on. Ceiling -1.0 dB, 4x oversampling, transparent mode, nothing else changed. The first 0.1 s is thrown away so the limiter is in steady state, and the window in the picture is the worst overshoot in the remaining second.
With True Peak off the sample peak obeys the ceiling exactly, -1.00 dB, while the reconstructed waveform reaches -0.22 dB: 0.78 dB above a ceiling the meter says you never touched. With True Peak on, the same signal measures -1.00 dB both ways - which is why that stage exists and why it is on by default.
2026-09-20
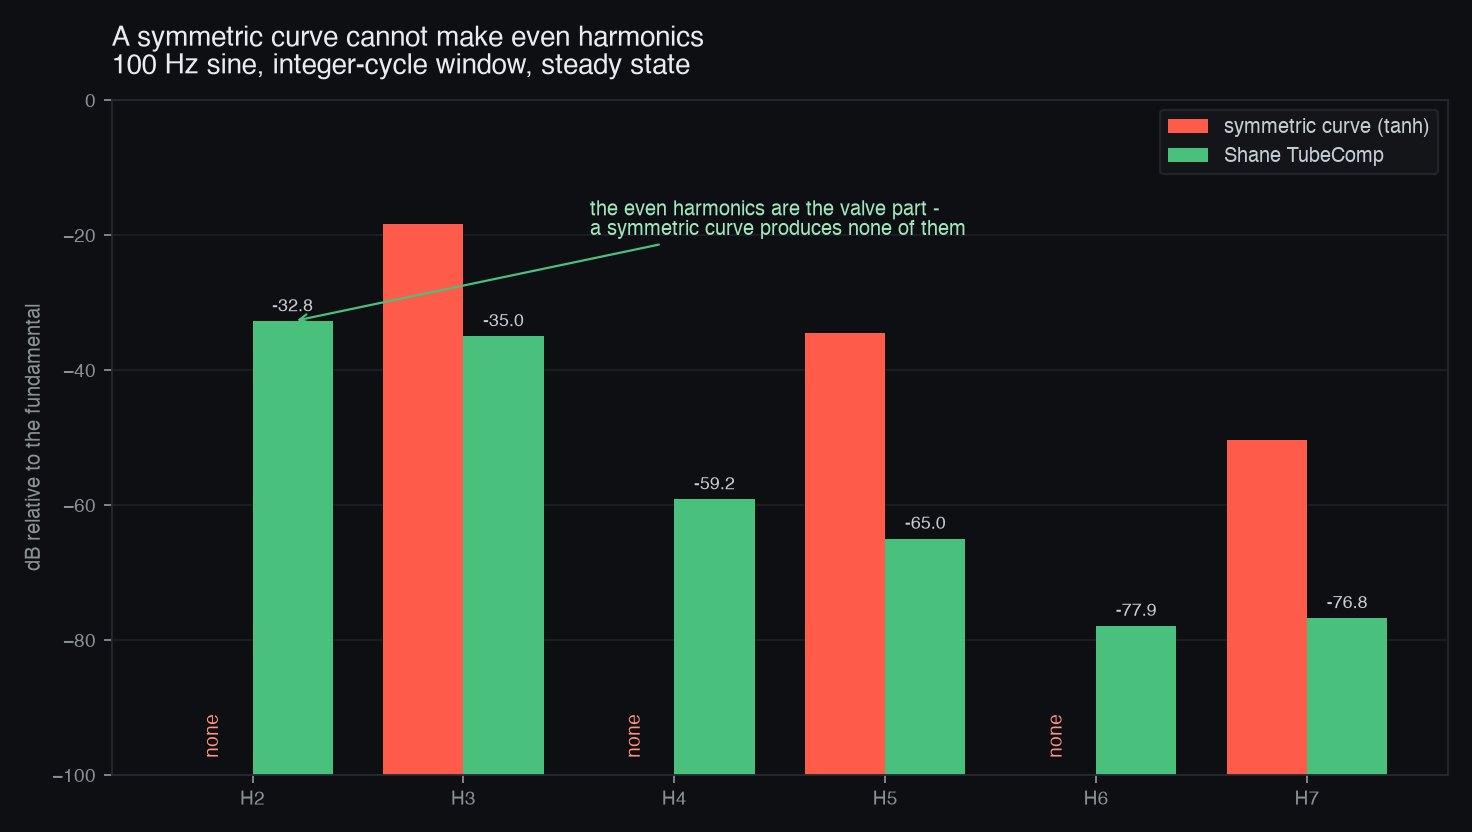
A symmetric curve cannot make even harmonics.
What you hear: the difference between a compressor that thickens a bass or a vocal as it works, and one that just gets louder and a little harder. The thickening is the second harmonic - and the curve most saturation is built on cannot produce it at all.
| H2 | H3 | H4 | H5 | H6 | H7 |
|---|
| symmetric tanh | none | -18.4 | none | -34.5 | none | -50.4 |
| Shane TubeComp | -32.8 | -35.0 | -59.2 | -65.0 | -77.9 | -76.8 |
The second harmonic is one octave above the note. Add it and the ear hears the same pitch, fuller - that is what people mean by warmth, body, thickness. The third harmonic is an octave and a fifth up, and it does something else entirely: it hardens and hollows. Push it far enough and you get the sound of a small amp being shouted through.
Which one you get is decided by the shape of the curve, not by what you call it. A curve that is symmetric about the origin - f(-x) = -f(x), and tanh is the usual one - can only produce odd harmonics. Its second harmonic is not small, it is absent. A valve stage is not symmetric: it bends differently on the two halves of the waveform, so the second harmonic arrives first and the odd ones sit underneath.
This is why the valve stage in Shane TubeComp is asymmetric rather than a tanh, and why the harmonic table is part of how it gets voiced: by ear, a missing second harmonic does not sound broken, only plain, and plain is easy to talk yourself out of noticing.
The test: a 100 Hz sine at -6 dBFS through a symmetric tanh and through the shipping Shane TubeComp driven hot, steady state only, integer-cycle window so that nothing leaks between bins and poses as a harmonic.
The symmetric curve reports no H2, H4 or H6 at all. Shane TubeComp leads with H2 at -32.8 dB and falls away in the order a valve stage should - which, on a bass or a vocal, is heard as density arriving with the gain reduction instead of hardness.